
How Escape Plan’s Shopify store doubled its daily Google clicks
From 162 to 345 clicks a day after SEO Sorted took over on May 1, 2026. Every number below comes from Escape Plan’s Google Search Console.
2.1×
Google clicks per day
3.1×
Google impressions per day
15×
blog clicks per day
331K
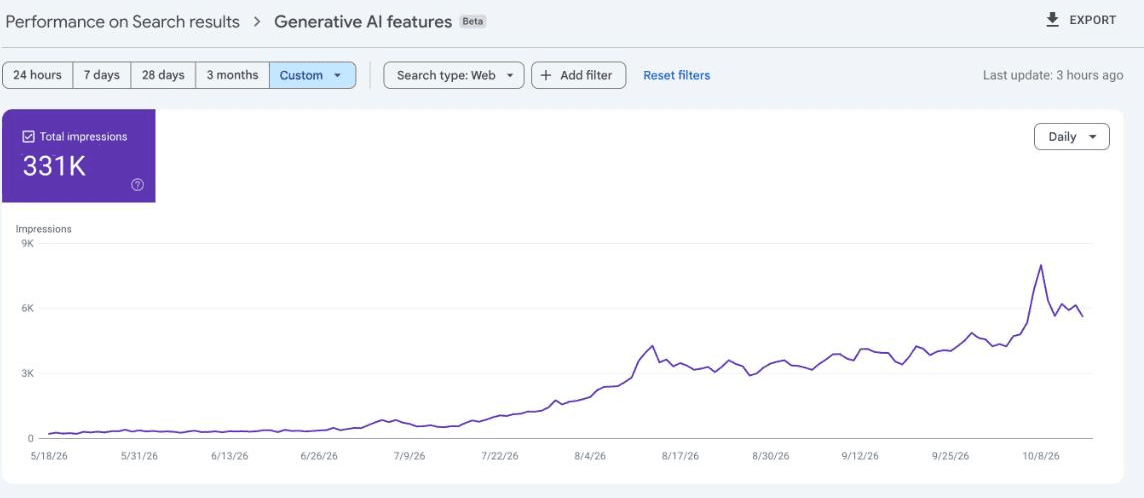
impressions in Google’s AI features
THE CHALLENGE
A busy store that mostly won on its own name.
Escape Plan sells luggage and travel gear in India, including HRX, Rare Rabbit and Snitch bags, from a Shopify store. In the six months before May 2026, it averaged 162 Google clicks a day. More than half of the clicks on listed searches (11,496 of 20,837) came from people already searching for the brand or its products by name, and the homepage alone took 17,358 of the 29,381 clicks.
The blog barely helped: 424 clicks in six months. Collection pages, where shoppers actually compare and buy, earned 3,161.
HOW IT HAPPENED
Technical fixes in month one, then content every week.
Here’s how daily clicks moved week by week after we started on May 1, 2026.
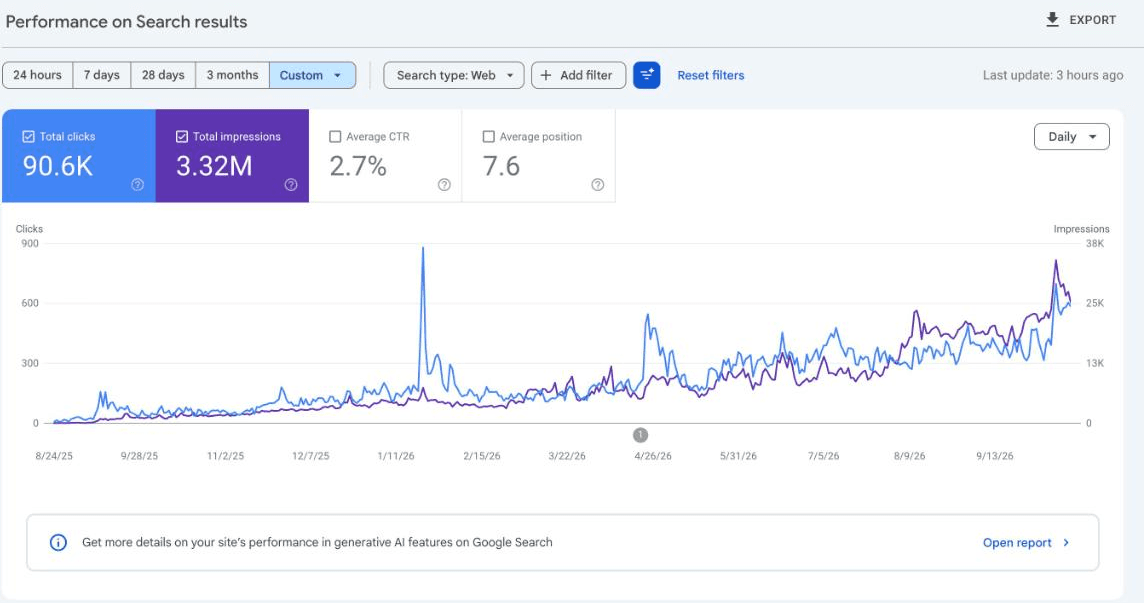
SEO Sorted started on May 1, 2026.
- Keyword research on what shoppers type. Brand + product searches (“hrx trolley bag”, “rare rabbit bags”, “snitch trolley bag”) and buying questions (bag sizes, airline baggage rules).
- Technical SEO in month one. The technical fixes were done in the first month.
- Collection pages for the searches that buy. Collection pages grew from 3,161 to 15,371 clicks (17.5 → 92.0 a day). The HRX trolley bags collection alone earned 9,854 clicks.
- A blog that answers travel questions. Blog clicks grew from 424 to 6,050 (2.3 → 36.2 a day). Guides on trolley bag sizes and airline baggage allowances now appear in Google’s AI answers.
- Content at scale, mostly automated. After month one, content was produced mostly automatically with SEO Sorted.
KEYWORD WINS
Winning the brand and category searches shoppers make.
| Target keyword | Before | After | Clicks (after) |
|---|---|---|---|
| “snitch trolley bag” | Not ranked | Pos 3.7 | 290 |
| “rare rabbit bags” | Pos 10.0 | Pos 4.3 | 145 |
| “rare rabbit backpack” | Pos 8.6 | Pos 4.7 | 162 |
| “hrx bags” | Pos 5.9 | Pos 3.5 | 391 |
Average Google position, Nov 1, 2025 – Apr 30, 2026 vs May 1 – Oct 14, 2026. “Not ranked” means not in the before-window top-1,000 query export. Source: Google Search Console.
IMPACT WE CREATED
More clicks from pages that sell, and a blog that finally works.
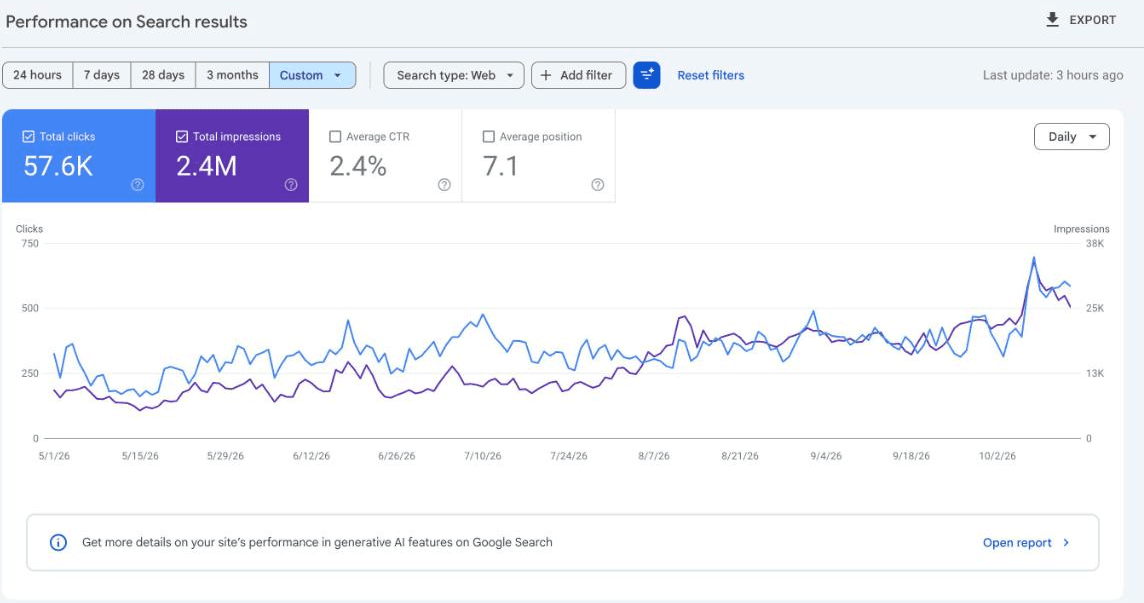
In May 1 – Oct 14, 2026, myescplan.com earned 57,586 clicks and 2.4 million impressions from Google. Of the top 1,000 searches, 343 average a top-three position, up from 194 before. Of the top 1,000 pages, 903 average a first-page position. Google’s AI features showed the site 331,395 times from May 18 to Oct 14.
BREAKOUT PAGE
/collections/hrx-trolley-bags: 9,854 clicks, 316,511 impressions, average position 4.1 (May 1 – Oct 14, 2026). It doesn’t appear in the before-window page export.
Top page in AI answers: /blogs/blog/trolley-bag-size-comparison-20-24-28-inch, 39,980 AI impressions.
What this data does not show
- Half the clicks are still brand searches. 18,583 of 37,890 clicks on listed searches include the store’s name (down from 55% to 49%).
- The homepage is the biggest single page. It got 24,305 of the 57,586 clicks (42%).
- Product brands drive much of the demand. Searches for HRX, Rare Rabbit and Snitch products depend on those brands’ own popularity.
- The last week is partial and spiky. The 577-a-day week (Oct 9–14) has 6 days and may include festive-season demand.
- Seasonality isn’t controlled. Before (Nov–Apr) and after (May–Oct) are different seasons for travel gear.
- Clicks are not orders. This page doesn’t cover sales or revenue.
- Sources and dates. Google Search Console, myescplan.com, all pages, web search. Before: Nov 1, 2025 – Apr 30, 2026. After: May 1 – Oct 14, 2026. Generative AI features report (beta) has data from May 18, 2026 only.
Running a Shopify or D2C store?
Get a free SEO + AI visibility report and see which shopper searches you could own.


Common questions
Every week since May 1 has averaged above the before-average of 162 clicks a day. Clicks reached nearly 400 a day (394) in the week of Jul 3, about two months in.
Technical fixes in the first month, then collection pages, blog content and other pages across the store.
Yes. Escape Plan’s collection pages grew from 3,161 to 15,371 Google clicks, and blog clicks grew 15× per day.
Each time a page is shown as a source in Google’s AI Overviews or AI Mode. Search Console reports it in the Generative AI features report.
Most of the content. After technical fixes in the first month, content was produced mostly automatically with SEO Sorted.