
How UXMagic grew from 6.5 to280 Google clicks a day
SEO Sorted has run UXMagic’s SEO since the site launched. Every number below comes from UXMagic’s Google Search Console.

43×
Google clicks per day
226×
Google impressions per day
66%
of clicks now from non-brand searches
143K
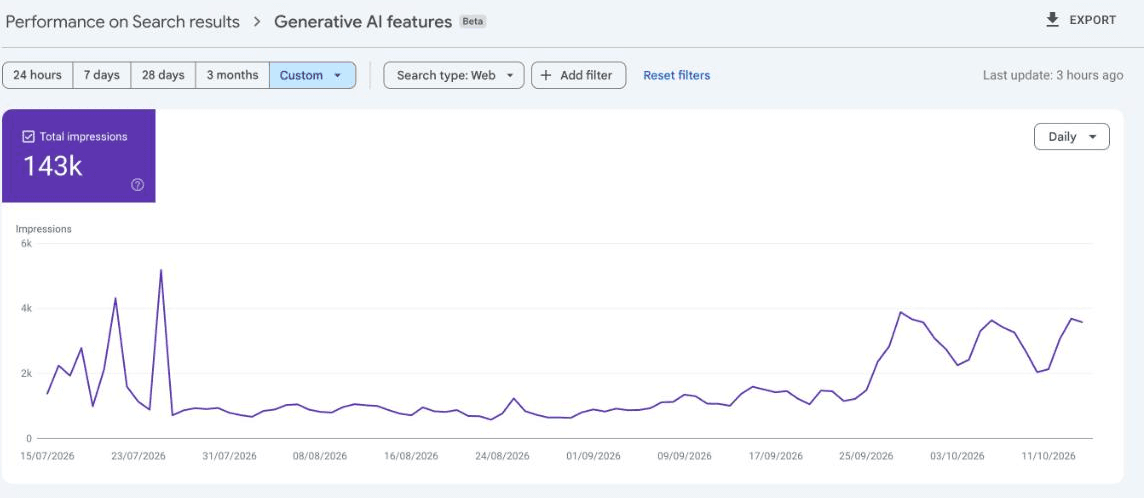
impressions in Google’s AI features
THE CHALLENGE
A new AI tool nobody was searching for yet.
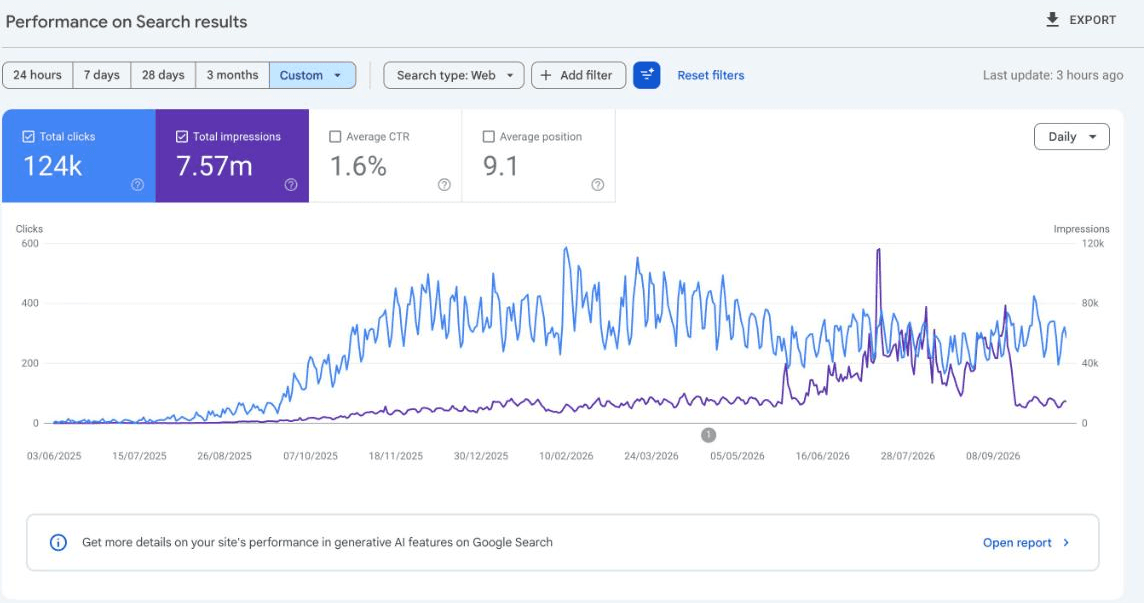
UXMagic turns text prompts and screenshots into UI designs. In its first month in Search Console (Jun 15 – Jul 14, 2025), the site got 196 Google clicks, about 6.5 a day. Every one of the 118 clicks on listed searches came from people who already knew the name (“uxmagic”, “ux magic”).
The category was crowded with funded tools, and almost nobody was searching for “image to UI” or “AI UI generator” by UXMagic’s name. To grow, UXMagic had to show up for what designers were actually typing.
HOW IT HAPPENED
Technical fixes first, then content at scale.
Here’s how daily clicks grew week by week, from June 2025 to October 2026.
- Keyword research first. We mapped what designers search for: tool jobs (“image to UI”, “clone website”), alternatives (“Google Stitch alternative”) and how-to questions.
- Technical SEO in month one. We fixed the technical issues in the first month so new pages could be crawled and indexed quickly.
- One page per job. We built feature pages for each tool job (AI UI design generator, clone any website, image to UI, image to wireframe) and compare pages for each competitor.
- Content at scale, mostly automated. After month one, content was produced mostly automatically. In Jul–Oct 2026, 319 blog pages earned clicks (from the top-1,000 page export).
KEYWORD WINS
Ranking for what designers actually type.
| Keyword | Before | After | Clicks after |
|---|---|---|---|
| “google stitch alternative” | Not ranked | Pos 2.1 | 81 |
| “image to ui” | Not ranked | Pos 2.9 | 109 |
| “image to wireframe converter” | Not ranked | Pos 3.1 | 72 |
| “ui design ai free” | Not ranked | Pos 4.7 | 113 |
Average Google position, Jun 15 – Jul 14, 2025 vs Jul 15 – Oct 14, 2026. “Not ranked” means the search doesn’t appear in the before-window export, which lists all 93 searches the site showed up for. Source: Google Search Console.
IMPACT WE CREATED
From brand-only traffic to a real acquisition channel.
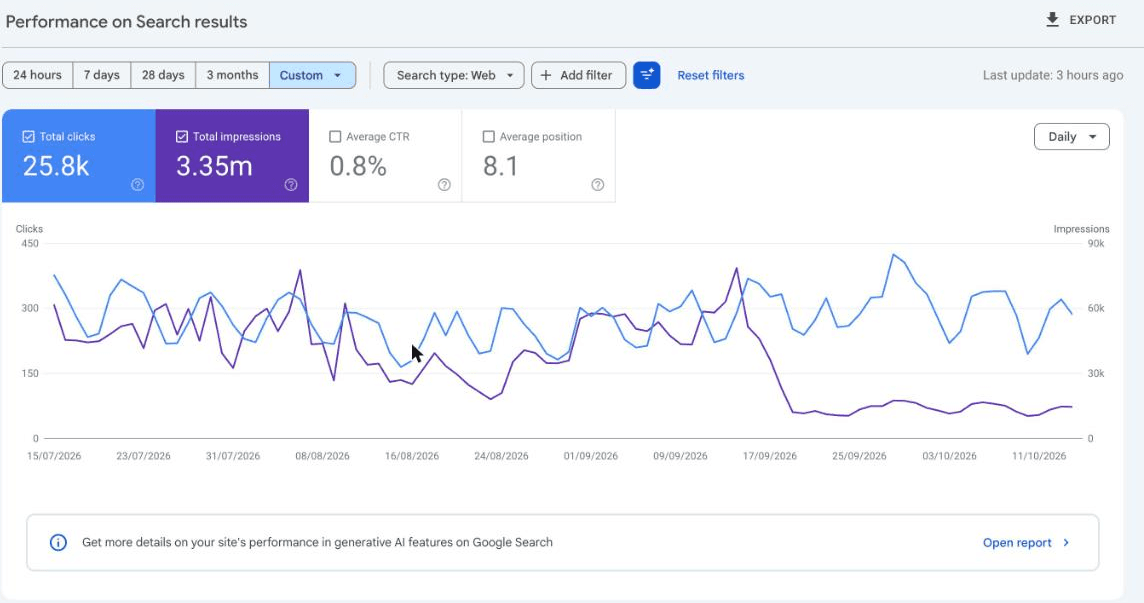
In Jul 15 – Oct 14, 2026, uxmagic.ai earned 25,759 clicks and 3.35 million impressions from Google. Of the top 1,000 searches, 799 average a first-page position and 58 average the top three, up from 24 and 10 (of 93) in the first month. Of the top 1,000 pages, 680 average a first-page position. Google’s AI features showed the site 143,142 times in the same period.
BREAKOUT PAGE
/ai-ui-design-generator: 5,013 clicks, 162,377 impressions, average position 10.9 (Jul 15 – Oct 14, 2026). In Google’s AI features, /clone-any-website leads with 21,530 impressions and /ai-ui-design-generator follows with 18,935.
What this data does not show
- Clicks are below the peak. Daily clicks peaked at 467 in the week of Feb 8, 2026. The Jul–Oct 2026 average of 280 a day is about 40% lower. Growth from zero is real, but the last six months have been flat to down.
- One-third of clicks are still brand searches. 4,277 of 12,656 clicks on listed searches include “uxmagic” or “ux magic”.
- The homepage is the biggest single page. It got 6,845 of the 25,759 clicks (27%).
- Most clicks come from India. 14,285 of 25,759 clicks (55%) came from India; the US is third with 1,031.
- Clicks are not sign-ups. This page doesn’t cover trials, sign-ups or revenue.
- The before window is short and early. It’s the earliest 30 days Search Console keeps, not a full pre-SEO baseline.
- Sources and dates. Google Search Console, uxmagic.ai, all pages, web search. Before: Jun 15 – Jul 14, 2025. After: Jul 15 – Oct 14, 2026. Generative AI features report (beta) has data from May 18, 2026 only.
Building an AI SaaS?
Get a free SEO + AI visibility report and see which searches you could own.

Common questions

Clicks passed 100 a day in the week of Sep 28, 2025, about four months after the start of the data. They peaked at 467 a day in February 2026.
Both. Feature pages for each tool job, compare pages for competitors and blog content. The feature pages bring the most clicks.
Most of it. After technical fixes in the first month, content was produced mostly automatically with SEO Sorted.
Each time a page is shown as a source in Google’s AI Overviews or AI Mode. Search Console reports it in the Generative AI features report.
The method does: find the jobs and alternatives your buyers search for, build a page for each, and publish steadily. Results depend on your category and competition.